The following table provides standard deviations and correlation coefficients relating to two risky securities,B and Z,and the market portfolio.Use this information to estimate the beta and expected returns on securities B and Z,assuming an expected return on the market portfolio of 12%,and a risk- free return of 5.5%. 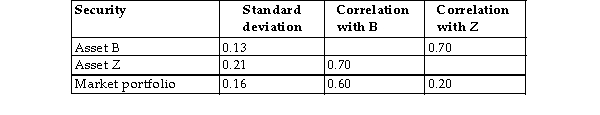
Correct Answer:
Verified
View Answer
Unlock this answer now
Get Access to more Verified Answers free of charge
Q16: A security with a fi of 0
Q17: An increase in systematic risk would cause
Q18: What is the beta of the market
Q19: The security market line plots the expected
Q20: Which of the following statements best describes
Q22: In general,individual stock returns appear to be
Q23: The efficient set of portfolios is _.
A)A
Q24: Which of the following statements best describes
Q25: According to the CAPM equation,which of the
Q26: What is the beta of a stock
Unlock this Answer For Free Now!
View this answer and more for free by performing one of the following actions

Scan the QR code to install the App and get 2 free unlocks

Unlock quizzes for free by uploading documents