The diagram below shows the short- run cost curves for 3 perfectly competitive firms in the same industry.
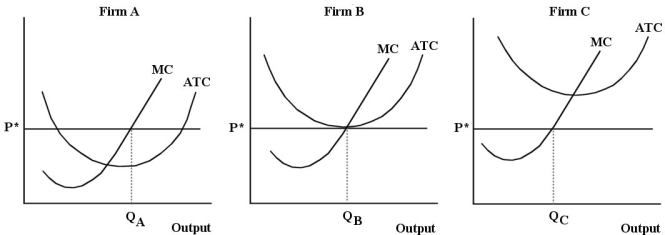 FIGURE 9- 6
-Refer to Figure 9- 6.Given that Firms A,B and C are in the same industry,is this industry in long- run equilibrium?
A) Yes,because all 3 firms are producing at their minimum average total cost.
B) No,because Firm A is not producing at a profit- maximizing level of output.
C) Yes,because each of the 3 firms is operating at its minimum efficient scale.
D) No,because if the industry were in equilibrium,all 3 firms would be earning zero economic profits.
E) Yes,because P = MC = MR for each of the 3 firms.
Correct Answer:
Verified
Q59: When a firm is referred to as
Q61: Suppose ABC Corp.is a firm producing newsprint
Q62: A firm is said to have "market
Q63: Which of the following terms would best
Q65: Suppose a perfectly competitive industry is in
Q66: Consider the following short- run cost curves
Q67: Assume the following total cost schedule
Q68: Suppose a paper mill in Quebec is
Q69: Consider the price and quantity data
Q73: ![]()
Unlock this Answer For Free Now!
View this answer and more for free by performing one of the following actions

Scan the QR code to install the App and get 2 free unlocks

Unlock quizzes for free by uploading documents