The figure below shows the isocost lines and the isoquant map for a firm producing golf tees.
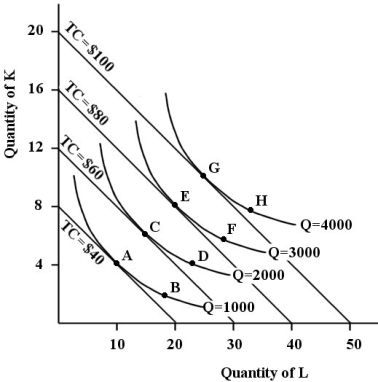 FIGURE 8- 6
-Refer to Figure 8- 6.Suppose this firm is producing 3000 golf tees and is at point F on the isoquant map.In order to maintain its output and minimize costs this firm should
A) move to an isoquant closer to the origin.
B) not change its use of factors.
C) employ more labour and less capital.
D) employ more capital and less labour.
E) move to an isocost line further from the origin.
Correct Answer:
Verified
Q11: Consider a firm in the long run
Q12: Which of the following paired concepts are
Q13: Of the following,which is the least likely
Q15: A very- long- run consideration that could
Q17: When there is no other way of
Q18: In the long run,a profit- maximizing firm
Q19: FIGURE 8- 4 Q20: Economists collect and analyze data on output Q21: The long- run average cost curve is Q101: ![]()
![]()
Unlock this Answer For Free Now!
View this answer and more for free by performing one of the following actions

Scan the QR code to install the App and get 2 free unlocks

Unlock quizzes for free by uploading documents