Multiple Choice
The figure below shows a family of cost curves for a firm.The subscripts 1,2,and 3 for the SRATC curves refer to different plant sizes.
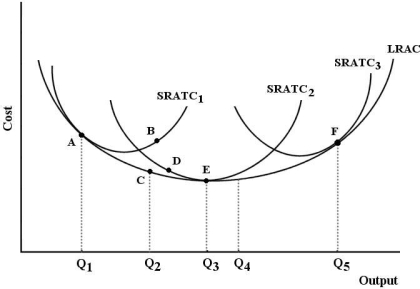 FIGURE 8- 3
-Refer to Figure 8- 3.If this firm is producing at point B,then
A) this firm is experiencing decreasing returns to scale.
B) it should employ more of its variable factors of production.
C) plant size 1 is optimal.
D) this firm is producing a level of output that is technically inefficient in the long run.
E) this firm could produce the same level of output at a lower cost with plant size 2.
Correct Answer:
Verified
Related Questions

