The diagram below shows some short- run cost curves for a firm.
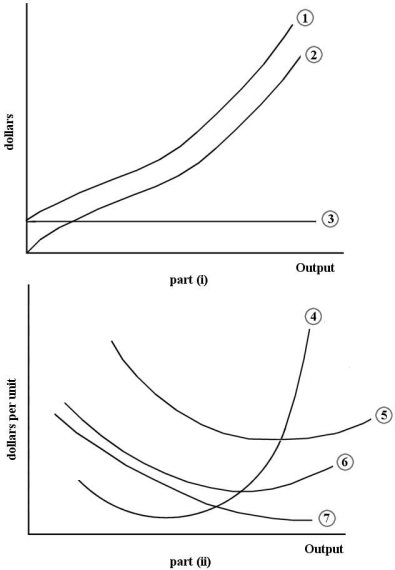 FIGURE 7- 2
-Refer to Figure 7- 2.Which of the following choices correctly identifies the cost curves in part (ii) of the figure?
A) Curve 4 is the marginal cost curve.Curve 5 is the average fixed cost curve. Curve 6 is the average variable cost curve.Curve 7 is the average total cost curve.
B) Curve 4 is the average fixed cost curve.Curve 5 is the average total cost curve.Curve 6 is the marginal cost curve. Curve 7 is the average variable cost curve.
C) Curve 4 is the marginal cost curve. Curve 5 is the average variable cost curve.Curve 6 is the average fixed cost curve.
Curve 7 is the average total cost curve.
D) Curve 4 is the marginal cost curve.Curve 5 is the average total cost curve. Curve 6 is the average variable cost curve.Curve 7 is the average fixed cost curve.
E) Curve 4 is the average total cost curve.Curve 5 is the marginal cost curve. Curve 6 is the average variable cost curve.Curve 7 is the average fixed cost curve.
Correct Answer:
Verified
Q4: In economics,the term "fixed costs" means
A)implicit costs.
B)costs
Q5: The table below provides the total
Q7: Diminishing marginal product of labour is said
Q8: A firm's short- run marginal cost curve
Q10: If a firm uses factor inputs that
Q11: The following data show the total
Q12: Consider a firm in the short run.If
Q13: The table below provides the annual
Q14: When a plant is operating at the
Q66: The following data show the total output
Unlock this Answer For Free Now!
View this answer and more for free by performing one of the following actions

Scan the QR code to install the App and get 2 free unlocks

Unlock quizzes for free by uploading documents