The diagram below shows a set of budget lines facing a household.
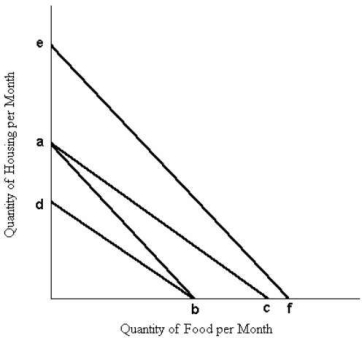 FIGURE 6- 8
-Refer to Figure 6- 8.The movement of the budget line from ab to ef could be caused by
A) a decrease in money income.
B) an equal percentage increase in the price of both food and housing.
C) a decrease in the price of either food or housing.
D) an equal percentage decrease in the price of both food and housing.
E) an increase in the price of either food or housing.
Correct Answer:
Verified
Q1: The marginal rate of substitution
A)is the amount
Q2: FIGURE 6- 12 Sophie consumes two goods
Q3: Given a particular market demand curve,consumer surplus
Q4: The table below shows the quantities
Q6: An equal proportional increase in money income
Q7: Assume an individual with a downward- sloping
Q8: Assume a person reveals the following demand
Q9: The Smith family is allocating its monthly
Q10: Economists use the term "marginal utility" to
Q11: Suppose the price of potatoes falls and
Unlock this Answer For Free Now!
View this answer and more for free by performing one of the following actions

Scan the QR code to install the App and get 2 free unlocks

Unlock quizzes for free by uploading documents