The diagram below shows the demand and supply curves for refrigerators in Canada.
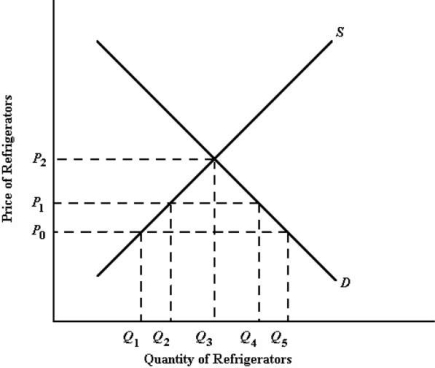 FIGURE 34- 1
-Refer to Figure 34- 1.At the price P0,the quantity of refrigerators imported into the Canadian market is
A) Q2Q4.
B) Q3Q5.
C) Q2Q5.
D) Q1Q5.
E) Q2Q3.
Correct Answer:
Verified
Q29: The diagram below shows the demand and
Q30: Many of the world's industrialized countries initially
Q31: The table below shows the prices
Q32: The diagram below shows the demand and
Q33: The diagram below shows the demand and
Q35: The North American Free Trade Agreement (NAFTA)is
Q36: Suppose Canada imposed more stringent quality standards
Q37: The diagram below shows the demand and
Q38: The diagram below shows the domestic demand
Q39: Continued tariff protection for industries that have
Unlock this Answer For Free Now!
View this answer and more for free by performing one of the following actions

Scan the QR code to install the App and get 2 free unlocks

Unlock quizzes for free by uploading documents