The diagram below shows the domestic demand and supply curves for denim jeans in Canada.The prevailing world price is PW.Assume that all jeans are identical.
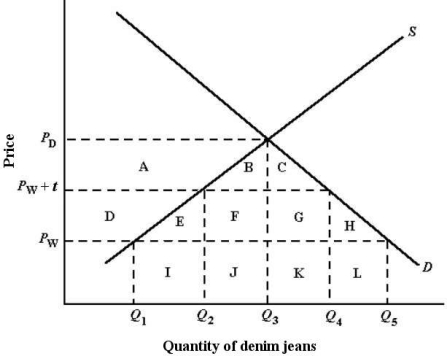 FIGURE 34- 2
-Refer to Figure 34- 2.Suppose Canada has free trade in jeans.If Canada initially has no tariff on jeans but then imposes a tariff of $t per pair,Canada's imports will
A) decrease from(Q5 - Q3) to (Q3 - Q1) .
B) decrease from (Q5 - Q3) to (Q4 - Q2) .
C) decrease from (Q5 - Q1) to (Q4 - Q2) .
D) increase from (Q4 - Q2) to (Q5 - Q3) .
E) increase from (Q4 - Q2) to (Q5 - Q1) .
Correct Answer:
Verified
Q106: The table below shows the prices
Q107: The diagram below shows the demand and
Q108: The diagram below shows the domestic demand
Q109: Which of the following policy objectives can
Q110: Continued tariff protection for industries that have
Q111: Suppose a national government chooses to impose
Q113: The diagram below shows the demand and
Q114: If a country is small in world
Q115: Canada and the United States have been
Q116: The diagram below shows the domestic demand
Unlock this Answer For Free Now!
View this answer and more for free by performing one of the following actions

Scan the QR code to install the App and get 2 free unlocks

Unlock quizzes for free by uploading documents