The Figure Below Shows Arcticland's Annual Production Possibilities Boundary for the Production
The figure below shows Arcticland's annual production possibilities boundary for the production of fish and ice.
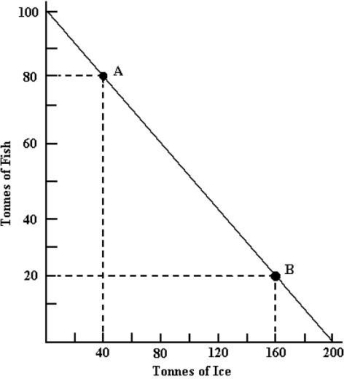 FIGURE 33- 4
-If Country A has a comparative advantage in the production of good X relative to Country B,
A) then the opportunity cost of producing X in Country A is higher than in Country B.
B) then Country A also has an absolute advantage in the production of this good.
C) then the opportunity cost of producing X in Country A is lower than in Country B.
D) we do not have enough information to say anything about relative opportunity costs.
E) then Country A also has an absolute advantage in the production of some good other than X.
Correct Answer:
Verified
Q27: The diagram below shows the domestic demand
Q28: The figure below shows Arcticland's annual production
Q29: If the index of export prices increases
Q30: The diagram below shows the domestic demand
Q31: When opportunity costs differ between countries,
A)only the
Q32: When opportunity costs are identical between two
Q34: The figure below shows Arcticland's annual production
Q35: When specialization according to comparative advantage also
Q36: Consider Canada's terms of trade.Canadians consume millions
Q37: The diagram below shows the (hypothetical)demand and
Unlock this Answer For Free Now!
View this answer and more for free by performing one of the following actions

Scan the QR code to install the App and get 2 free unlocks

Unlock quizzes for free by uploading documents