The diagram below shows supply and demand diagrams (S and D) for some product.The government then imposes an excise tax.The new supply curve is ST.
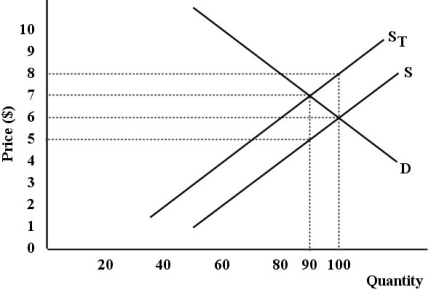 FIGURE 18- 4
-Refer to Figure 18- 4.What is the dollar value of the excess burden of this tax?
A) $2
B) $10
C) $5
D) $40
E) $1
Correct Answer:
Verified
Q20: Suppose taxes are levied in the following
Q21: The most important source of revenue for
Q22: The diagram below shows supply and demand
Q23: In Canada,public primary and secondary education
A)have eliminated
Q24: In Canada,post- secondary education is
A)a provincial responsibility,funded
Q26: The federal corporate income tax in Canada
Q27: In Canada,students' tuition fees for post- secondary
Q28: Consider two families,each of whom earn total
Q29: The figure below show a simplified version
Q30: The table below shows 2012 federal
Unlock this Answer For Free Now!
View this answer and more for free by performing one of the following actions

Scan the QR code to install the App and get 2 free unlocks

Unlock quizzes for free by uploading documents