The figure below shows the demand and supply curves for pollution abatement.
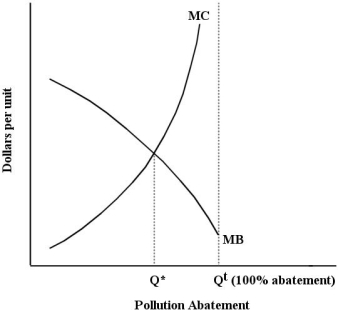 FIGURE 17- 3
-Refer to Figure 17- 3.On the horizontal axis,the label "Qt(100% abatement) " refers to
A) the maximum pollution abatement that is cost effective.
B) zero pollution abatement.
C) the maximum pollution abatement attainable at the lowest cost.
D) zero remaining pollution.
E) the maximum pollution abatement attainable with given technology.
Correct Answer:
Verified
Q9: Consider a coal- fired electric- power plant
Q10: The figure below shows the marginal benefit
Q11: The figure below shows the marginal benefit
Q12: In a competitive market for tradable pollution
Q13: Suppose a firm producing roof shingles imposes
Q15: When firms in an industry have fully
Q16: The diagram below shows the marginal cost
Q17: Consider global greenhouse- gas emissions.Suppose that in
Q18: The figure below shows the marginal benefit
Q19: Global greenhouse- gas (GHG)emission reductions are unlikely
Unlock this Answer For Free Now!
View this answer and more for free by performing one of the following actions

Scan the QR code to install the App and get 2 free unlocks

Unlock quizzes for free by uploading documents