The diagram below shows the marginal cost of abatement for each of two firms,A and B.Each firm is initially abating Q0 units of pollution.
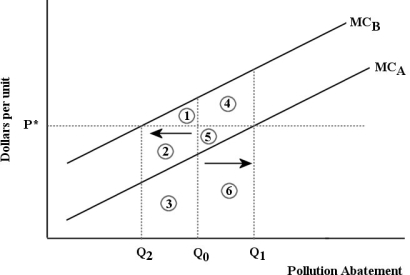 FIGURE 17- 6
-Refer to Figure 17- 6.Suppose that a system of tradable pollution permits is introduced into this market and the equilibrium permit price is p×.Firm A will sell permits to Firm B because
A) Firm B has lower costs of pollution abatement than Firm A.
B) Firm A's total cost of abating more pollution (areas 5 + 6) is less than the revenue it earns from selling the permits (areas 4 + 5 + 6) .
C) the revenue Firm A earns from selling permits (areas 5 + 6) is greater than the cost it incurs from abating more pollution (area 6) .
D) Firm A's total cost of abating more pollution (area 6) is less than the revenue it earns from selling the permits (area 4 + 5) .
E) Firm A can buy the permits at a lower price than Firm B.
Correct Answer:
Verified
Q2: A paper mill discharges chemicals into a
Q3: The diagram below shows the private and
Q4: Economists often argue that a system of
Q5: Two firms,A and B,are legally required to
Q6: The diagram below shows a market for
Q8: Suppose the government imposes an emissions tax
Q9: Consider a coal- fired electric- power plant
Q10: The figure below shows the marginal benefit
Q11: The figure below shows the marginal benefit
Q12: In a competitive market for tradable pollution
Unlock this Answer For Free Now!
View this answer and more for free by performing one of the following actions

Scan the QR code to install the App and get 2 free unlocks

Unlock quizzes for free by uploading documents