The diagram below shows the private and social marginal costs (MCP and MCS) and the social marginal benefits (MBS) of producing disposable diapers.
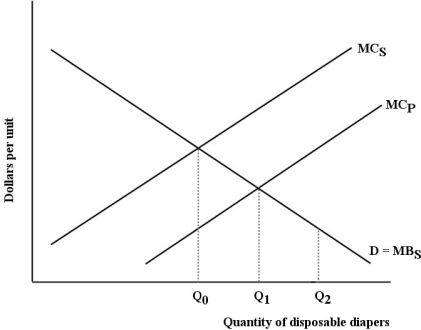 FIGURE 17- 2
-Refer to Figure 17- 2.The net social benefit derived from the production and use of the last unit of disposable diapers is
A) at a maximum at Q0,because that is where MCS equals MBS.
B) zero at Q2,because that is where the externality is fully maximized.
C) at a minimum at Q0,because MCS exceeds MCP.
D) at a maximum at Q1,because that is where MCS equals MBS.
E) zero at Q0,because that is where MCS equals MBS.
Correct Answer:
Verified
Q20: The figure below shows the marginal benefit
Q27: The diagram below shows the marginal cost
Q28: The optimal amount of pollution abatement is
Q29: The diagram below shows the marginal costs
Q30: Between 1990 and 2009,Canada's greenhouse gas emissions
Q31: The figure below shows the demand and
Q33: Economists generally view pollution as
A)a negative economy.
B)a
Q35: Suppose a per- unit tax is imposed
Q36: Which of the following groupings of major
Q37: When a farmer in Manitoba produces fertilizer
Unlock this Answer For Free Now!
View this answer and more for free by performing one of the following actions

Scan the QR code to install the App and get 2 free unlocks

Unlock quizzes for free by uploading documents