The figure below shows the demand and supply curves for pollution abatement.
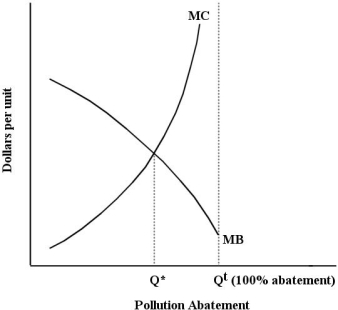 FIGURE 17- 3
-Refer to Figure 17- 3.The socially optimal amount of pollution is
A) Q* + Qt.
B) Qt.
C) Qt - Q*.
D) 0.
E) Q*.
Correct Answer:
Verified
Q17: Consider global greenhouse- gas emissions.Suppose that in
Q18: The figure below shows the marginal benefit
Q19: Global greenhouse- gas (GHG)emission reductions are unlikely
Q20: The diagram below shows the marginal cost
Q21: Direct pollution controls can be inefficient because,for
Q23: Suppose a farm that is polluting an
Q24: If residential garbage collection were financed by
Q25: Suppose a firm producing roof shingles imposes
Q26: The diagram below shows the marginal costs
Q27: The diagram below shows the marginal cost
Unlock this Answer For Free Now!
View this answer and more for free by performing one of the following actions

Scan the QR code to install the App and get 2 free unlocks

Unlock quizzes for free by uploading documents