The figure below shows the demand and supply curves for pollution abatement.
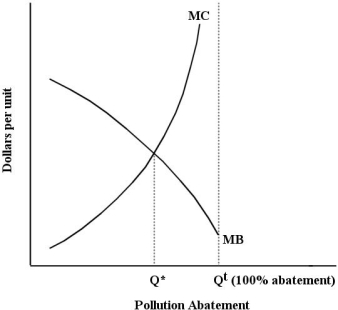 FIGURE 17- 3
-The socially optimal level of output of any good is the quantity where all marginal costs of production,private plus external,equal the
A) average benefit to society.
B) marginal benefit to society.
C) total benefit to society.
D) marginal cost of production.
E) marginal benefit to the firm.
Correct Answer:
Verified
Q20: The figure below shows the marginal benefit
Q26: The diagram below shows the marginal costs
Q27: The diagram below shows the marginal cost
Q28: The optimal amount of pollution abatement is
Q29: The diagram below shows the marginal costs
Q30: Between 1990 and 2009,Canada's greenhouse gas emissions
Q32: The diagram below shows the private and
Q33: Economists generally view pollution as
A)a negative economy.
B)a
Q35: Suppose a per- unit tax is imposed
Q36: Which of the following groupings of major
Unlock this Answer For Free Now!
View this answer and more for free by performing one of the following actions

Scan the QR code to install the App and get 2 free unlocks

Unlock quizzes for free by uploading documents