The diagram below shows the marginal cost of abatement for each of two firms,A and B.Each firm is initially abating Q0 units of pollution.
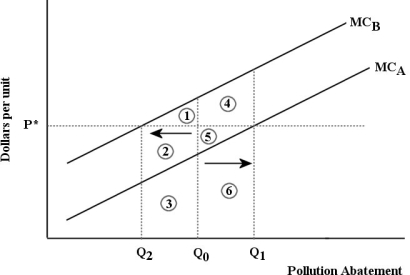 FIGURE 17- 6
-Refer to Figure 17- 6.Suppose that a system of tradable pollution permits is introduced into this market and the equilibrium permit price is p*.Firm B will buy permits from Firm A because
A) Firm B has lower costs of pollution abatement than Firm A.
B) its total savings from abating less (areas 1+2+3) exceed the cost of buying the permits (areas 2+3) .
C) Firm B can buy the permits at a lower price than Firm A.
D) its total cost of abating less (areas 1+2+3) exceeds the cost of buying the permits (areas 2+3) .
E) its total savings from abating less (areas 1+2+3) exceed the total costs of Firm A abating more (area 6) .
Correct Answer:
Verified
Q40: A potential disadvantage of emissions taxes versus
Q41: The table below shows the marginal
Q42: Direct controls for reducing pollution are likely
Q43: The social marginal cost of the production
Q44: The diagram below shows the marginal cost
Q46: Consider the following equation: GHG = GHG
Q47: The figure below shows the marginal benefit
Q48: If pollution is associated with the production
Q49: In 2006,Professor Nicolas Stern of the United
Q50: The diagram below shows the marginal costs
Unlock this Answer For Free Now!
View this answer and more for free by performing one of the following actions

Scan the QR code to install the App and get 2 free unlocks

Unlock quizzes for free by uploading documents