The diagram below shows the marginal cost of pollution abatement for two firms,Firm X and Firm Y.
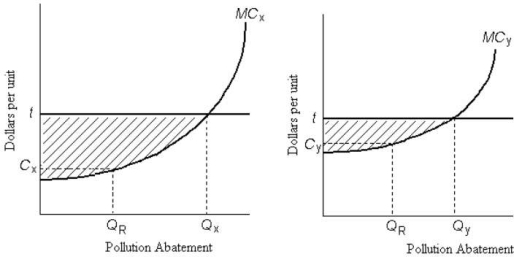 FIGURE 17- 4
-Refer to Figure 17- 4.There is an emissions tax of $t per unit of pollution.The resulting amount of pollution abatement is socially optimal if
A) the emissions tax is equal to the marginal social cost of pollution.
B) the emissions tax causes no change in firms' polluting activity.
C) each firm abates at QR.
D) Firm X abates QX and Firm Y abates QY.
E) each firm pays the maximum amount of tax.
Correct Answer:
Verified
Q54: Suppose a farm that is polluting an
Q55: Consider the following equation: GHG = GHG
Q56: Two firms,A and B,are legally required to
Q57: The main advantage of using market- based
Q58: All of the following are examples of
Q60: A paper mill discharges chemicals into a
Q61: The diagram below shows the marginal costs
Q62: When comparing a system of emission taxes
Q63: A paper mill discharges chemicals into a
Q64: The marginal benefit of reducing pollution and
Unlock this Answer For Free Now!
View this answer and more for free by performing one of the following actions

Scan the QR code to install the App and get 2 free unlocks

Unlock quizzes for free by uploading documents