The diagram below shows the marginal costs of pollution abatement for two firms,Firm 1 and Firm 2.
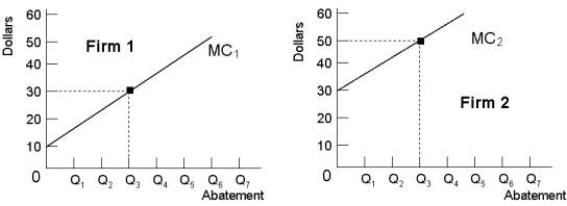 FIGURE 17- 5
-Refer to Figure 17- 5.Suppose Firm 1 and Firm 2 are each abating Q3 units of pollution.If the government imposed an emissions tax of $40 per unit of emissions,and this tax rate was known to equal the social marginal cost of pollution,then we can predict with confidence that
A) each firm would abate to the same level.
B) each firm would abate to Q3.
C) the resulting level of pollution would be optimal.
D) Firm 2 would increase its emissions and this would not be socially optimal.
E) Firm 2 would increase abatement beyond Q3 and Firm 1 would abate less than Q3.
Correct Answer:
Verified
Q45: The diagram below shows the marginal cost
Q46: Consider the following equation: GHG = GHG
Q47: The figure below shows the marginal benefit
Q48: If pollution is associated with the production
Q49: In 2006,Professor Nicolas Stern of the United
Q51: Zero pollution is almost surely NOT a
Q52: The marginal benefit of reducing pollution and
Q53: The marginal benefit of reducing pollution and
Q54: Suppose a farm that is polluting an
Q55: Consider the following equation: GHG = GHG
Unlock this Answer For Free Now!
View this answer and more for free by performing one of the following actions

Scan the QR code to install the App and get 2 free unlocks

Unlock quizzes for free by uploading documents