The diagram below shows a market for tradable pollution permits.
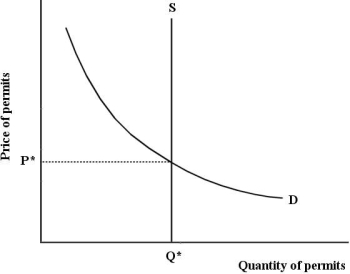 Figure 17- 7
-Refer to Figure 17- 7,which depicts the market for tradable pollution permits.The amount of permits Q* is determined by
A) market forces.
B) the level of abatement technology.
C) large corporations.
D) the relevant government.
E) the World Environmental Organization.
Correct Answer:
Verified
Q74: The diagram below shows the marginal cost
Q75: When considering an entire industry,the marginal benefit
Q76: Consider the following equation: GHG = GHG
Q77: When the marginal costs of pollution abatement
Q78: A pollution- control policy that,in principle,can perfectly
Q80: Zero environmental damage is probably
A)technologically possible but
Q81: The figure below shows the demand and
Q82: Given that different firms typically have different
Q83: The marginal benefit of reducing pollution in
Q84: The diagram below shows the marginal costs
Unlock this Answer For Free Now!
View this answer and more for free by performing one of the following actions

Scan the QR code to install the App and get 2 free unlocks

Unlock quizzes for free by uploading documents