The diagram below shows a market for tradable pollution permits.
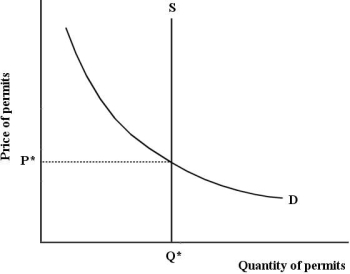 Figure 17- 7
-Refer to Figure 17- 7,which depicts the market for tradable pollution permits.If there is an increase in firms' marginal cost of pollution abatement,
A) firms require exactly Q* permits.
B) firms decide to abate more pollution.
C) firms will demand fewer pollution permits.
D) firms will demand more pollution permits.
E) the price of pollution permits will fall.
Correct Answer:
Verified
Q93: Suppose the government imposes a tax for
Q94: Suppose a firm producing roof shingles imposes
Q95: The countries that signed the Kyoto Protocol
Q96: A downward- sloping marginal benefit curve for
Q97: The diagram below shows the marginal cost
Q99: An important reason that direct controls are
Q100: Refer to Figure 17- 4.Ignore the horizontal
Q101: The diagram below shows a market for
Q102: The diagram below shows a market for
Q103: The diagram below shows the marginal cost
Unlock this Answer For Free Now!
View this answer and more for free by performing one of the following actions

Scan the QR code to install the App and get 2 free unlocks

Unlock quizzes for free by uploading documents