The diagram below shows demand and supply curves for some perfectly competitive market.
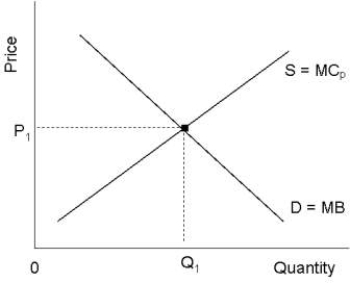 FIGURE 16- 2
-Refer to Figure 16- 2.Suppose that the marginal benefit curve (MB) includes all social benefits and that there are no externalities in production.In this case,for allocative efficiency.
A) P1 and Q1 are appropriate
B) the price P1 is appropriate but the quantity Q1 is too high
C) the price P1 is appropriate but the quantity Q1 is too low
D) the price P1 is too high but the quantity Q1 is appropriate
E) the price P1 is too low but the quantity Q1 is appropriate
Correct Answer:
Verified
Q21: When prices are determined in a free-
Q22: The diagram below shows the marginal benefit
Q23: Private markets will always provide too few
Q24: FIGURE 16- 1 Q25: Economists use the term "market failure" to Q27: The efficient price to charge consumers for Q28: Consider a non- rivalrous good,like national defence,provided Q29: Which of the following is the best Q30: FIGURE 16- 1 Q31: The existence of imperfectly competitive firms implies![]()
![]()
Unlock this Answer For Free Now!
View this answer and more for free by performing one of the following actions

Scan the QR code to install the App and get 2 free unlocks

Unlock quizzes for free by uploading documents