The diagram below shows demand and supply curves for some perfectly competitive market.
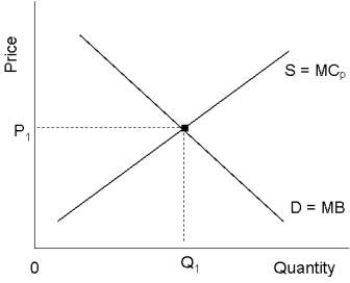 FIGURE 16- 2
-Refer to Figure 16- 2.Suppose that the marginal benefit curve (MB) includes all social benefits and that there is a positive externality in production.In this case,for allocative efficiency.
A) the price P1 is appropriate but the quantity Q1 is too low
B) the price P1 is too low and the quantity Q1 is too high
C) the price P1 is too high and the quantity Q1 is too low
D) P1 and Q1 are appropriate
E) the price P1 is appropriate but the quantity Q1 is too high
Correct Answer:
Verified
Q68: An example of a public good is
A)air
Q69: Which of the following best explains why
Q70: The total costs of government intervention in
Unlock this Answer For Free Now!
View this answer and more for free by performing one of the following actions

Scan the QR code to install the App and get 2 free unlocks

Unlock quizzes for free by uploading documents