The three diagrams below show the supply and demand for teenage babysitters in one local area. The initial supply curve is S 0 in all cases.
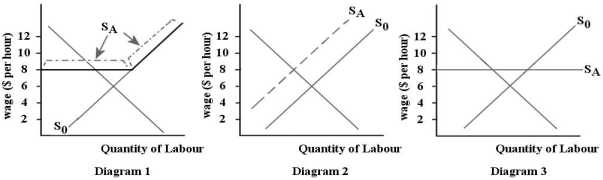
-Refer to Figure 14-3. Suppose all of the teenage babysitters in one local area form an association and set a minimum acceptable wage of $8 per hour. Which diagram illustrates the new supply curve S A) for babysitters?
A) diagram 1
B) diagram 2
C) diagram 3
D) none of the diagrams
E) any of the diagrams
Correct Answer:
Verified
Q43: The three diagrams below show the supply
Q45: The diagram below shows the supply and
Q46: Consider a small,remote town with only one
Unlock this Answer For Free Now!
View this answer and more for free by performing one of the following actions

Scan the QR code to install the App and get 2 free unlocks

Unlock quizzes for free by uploading documents