The diagram below shows the supply and demand for labour in a hypothetical town in northern British Columbia,with only one employer,a logging company.
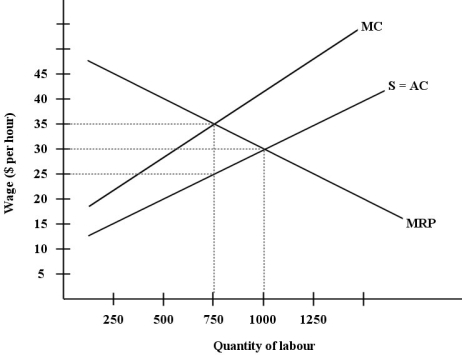 FIGURE 14- 4
-A typical firm hiring in a perfectly competitive labour market faces a labour supply curve that
A) coincides with the firm's marginal cost of labour curve.
B) is upward sloping.
C) coincides with the firm's demand for labour curve.
D) is downward sloping.
E) coincides with the firm's marginal cost curve.
Correct Answer:
Verified
Q37: FIGURE 14- 1 Suppose an island economy
Q38: Unions currently represent employed workers in Canada.
A)less
Q39: If competitive labour market E discriminates against
Q40: FIGURE 14- 1 Suppose an island economy
Q43: For a monopsonist that faces an upward-
Q44: FIGURE 14- 2 Q45: FIGURE 14- 6 Q46: The three diagrams below show the supply Q46: FIGURE 14- 5 Q47: In the 1950s and 1960s,Arvida,Quebec,was basically a Unlock this Answer For Free Now! View this answer and more for free by performing one of the following actions Scan the QR code to install the App and get 2 free unlocks Unlock quizzes for free by uploading documents![]()
![]()
![]()

