The diagram below shows the supply and demand for labour in a hypothetical town in northern British Columbia,with only one employer,a logging company.
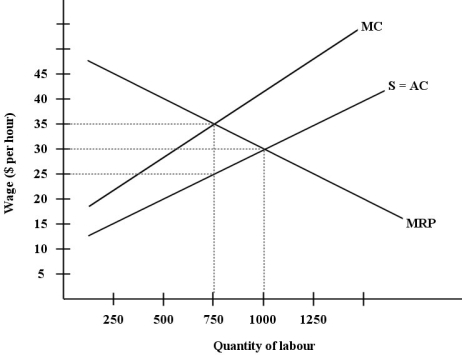 FIGURE 14- 4
-Suppose that the professional association of dentists reduces entry into their profession by lengthening the required training program.The likely effect is that
A) the supply curve of dentists will shift to the right.
B) the supply curve of dentists will shift to the left.
C) there will be an increase in the quantity of dentists supplied.
D) the demand curve for dentists will shift to the right.
E) both the demand and supply curves for dentists will shift to the left.
Correct Answer:
Verified
Q43: The three diagrams below show the supply
Q64: During recessions,individual investment in higher education typically
Q65: The diagram below shows the supply and
Q66: Suppose that a regional health authority is
Q67: Q70: Which of the following statements about minimum- Q72: The table below shows the labour Q73: If a minimum wage is set above Q74: FIGURE 14- 5 Q83: Economists observe clear evidence of a union![]()
![]()
Unlock this Answer For Free Now!
View this answer and more for free by performing one of the following actions

Scan the QR code to install the App and get 2 free unlocks

Unlock quizzes for free by uploading documents