The diagram below shows the supply and demand for labour in a hypothetical town in northern British Columbia,with only one employer,a logging company.
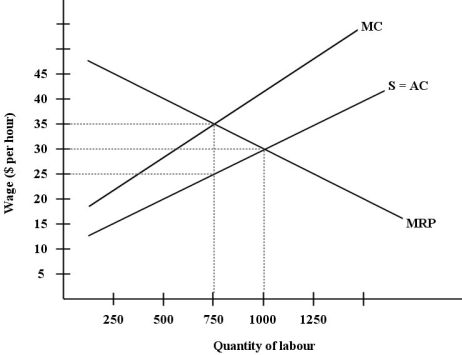 FIGURE 14- 4
-Refer to Figure 14- 4.Suppose this labour market is in a monopsonistic equilibrium.Then,suppose the workers form a union and negotiate a higher wage with the firm.In this case the wage will be and the employment will be .
A) above $35 per hour; less than 750 units of labour
B) $35 per hour; 750 units of labour
C) between $25 and $35 per hour; between 750 and 1000 units of labour
D) above $25 per hour; above or below 750 units of labour,depending on the negotiated wage
E) $30 per hour; 1000 units of labour
Correct Answer:
Verified
Q58: As a seller of labour services,a labour
Q59: The table below shows the labour
Q60: Suppose there is a competitive market for
Q61: One or two generations ago,fewer Canadians completed
Q62: FIGURE 14- 5 Q64: During recessions,individual investment in higher education typically Q65: The diagram below shows the supply and Q66: Suppose that a regional health authority is![]()
Unlock this Answer For Free Now!
View this answer and more for free by performing one of the following actions

Scan the QR code to install the App and get 2 free unlocks

Unlock quizzes for free by uploading documents