FIGURE 13- 4 The three diagrams below each show a supply curve for oil tankers over a relatively short period of time.
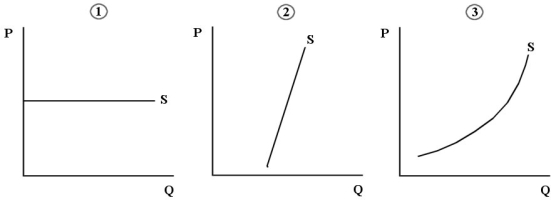
-Refer to Figure 13- 4.Consider the supply of oil tankers to an individual Canadian shipping firm,the North American shipping industry,and the world shipping industry.Which diagram best shows the supply of oil tankers that is relevant to the world shipping industry?
A) diagram 1
B) diagram 2
C) diagram 3
D) diagrams 2 or 3
E) diagrams 1 or 2
Correct Answer:
Verified
Q21: The table below shows the total
Q22: Consider computer programmers as a factor of
Q23: FIGURE 13- 3 The demand and supply
Q24: If the supply curve for a factor
Q25: Consider labour that is hired for $18
Q27: Consider the following production and cost
Q28: The table below shows the total
Q29: The diagram below shows the MRP curve
Q30: Consider the following demand and supply curves
Q31: Choose the statement that best describes the
Unlock this Answer For Free Now!
View this answer and more for free by performing one of the following actions

Scan the QR code to install the App and get 2 free unlocks

Unlock quizzes for free by uploading documents