FIGURE 13- 1 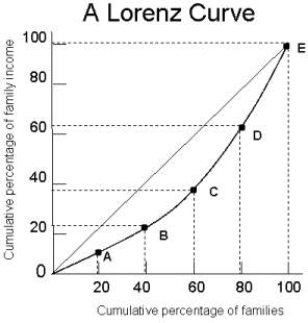
-Refer to Figure 13- 1.The diagonal line in the diagram
A) has no real purpose.
B) shows the distribution of income over time.
C) shows where the Lorenz curve would be if there were complete income equality.
D) illustrates the functional distribution of income.
E) shows the actual distribution of income.
Correct Answer:
Verified
Q64: FIGURE 13- 3The demand and supply curves
Q65: Consider the following production and cost
Q66: The table below shows the total
Q67: Consider the following production and cost
Q68: When the wage paid to workers in
Q70: Consider the following table for a
Q71: Consider the following production and cost
Q72: The marginal revenue product curve for a
Q73: Which of the following statements about equilibrium
Q74: Consider labour hired for $18 per hour.If
Unlock this Answer For Free Now!
View this answer and more for free by performing one of the following actions

Scan the QR code to install the App and get 2 free unlocks

Unlock quizzes for free by uploading documents