The diagram below shows the market demand curve and the cost curves for a single firm.
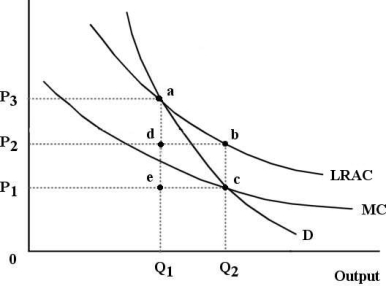 FIGURE 12- 6
-Refer to Figure 12- 6.Suppose this firm is being regulated using a policy of average- cost pricing.In this case,economic profits to the firm are represented by the area
A) 0P3aQ1.
B) P1P2bc.
C) P2P3ad.
D) P2P3ab.
E) There are no economic profits.
Correct Answer:
Verified
Q1: In Canada,alleged violations of the Competition Act
Q2: The diagram below shows cost and revenue
Q4: If average- cost pricing is imposed on
Q5: When comparing a perfectly competitive firm and
Q6: Productive efficiency for an individual firm requires
Q8: For an entire economy,allocative efficiency requires that
A)price
Q9: In principle,a comparison of the long- run
Q10: There has been a trend toward less
Q11: Consider a natural monopoly that is producing
Q63: The diagram below shows the demand and
Unlock this Answer For Free Now!
View this answer and more for free by performing one of the following actions

Scan the QR code to install the App and get 2 free unlocks

Unlock quizzes for free by uploading documents