The diagram below shows the demand and supply curves in a perfectly competitive market.
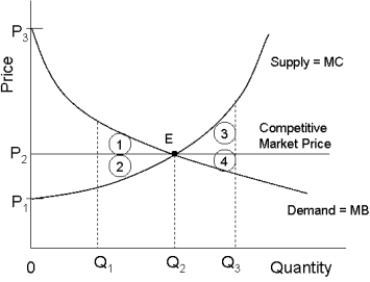 FIGURE 12- 5
-Refer to Figure 12- 5.If output in this market were Q1,but the price was still at its free- market level,the loss in consumer surplus relative to the competitive equilibrium would be illustrated by area
A) P1P3E.
B) 2.
C) P3P2E.
D) 1 + 2.
E) 1.
Correct Answer:
Verified
Q46: In general,the sum of consumer and producer
Q47: Suppose there are only two firms (Firms
Q49: Which of the following is the definition
Q52: The diagram below shows supply,demand,and quantity exchanged
Q53: FIGURE 12- 3 Q54: Choose the statement that best describes the Q55: FIGURE 12- 2 The production possibilities boundary![]()
Unlock this Answer For Free Now!
View this answer and more for free by performing one of the following actions

Scan the QR code to install the App and get 2 free unlocks

Unlock quizzes for free by uploading documents