The diagram below shows demand and cost curves for a monopolistically competitive firm.
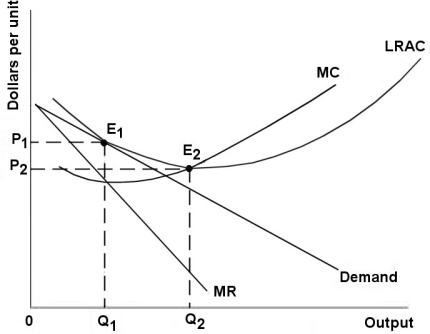 FIGURE 11- 3
-Refer to Figure 11- 3.A monopolistically competitive firm is said to be inefficient because in the long- run equilibrium
A) price is greater than MC at Q1.
B) price is greater than LRAC at Q1.
C) LRAC at Q1 is not at its minimum.
D) MC is greater than LRAC.
E) MC is greater than price.
Correct Answer:
Verified
Q15: Q16: Q17: The diagram below shows selected cost and Q18: The diagram below shows demand and cost Q19: The diagram below shows demand and cost Q21: Consider the following characteristics of a particular Q22: The sugar industry in Canada is effectively Q23: The table below shows the market Q24: With respect to imperfectly competitive markets,an "administered" Q25: Suppose two firms,Allstom from France,and Bombardier
Unlock this Answer For Free Now!
View this answer and more for free by performing one of the following actions

Scan the QR code to install the App and get 2 free unlocks

Unlock quizzes for free by uploading documents