The diagram below shows selected cost and revenue curves for a firm in a monopolistically competitive industry.
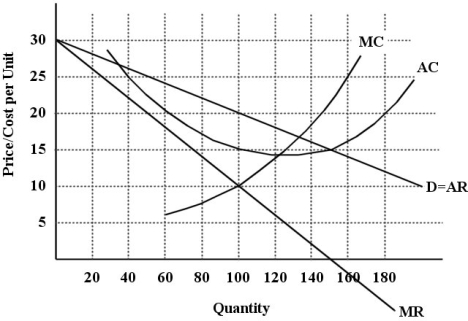 FIGURE 11- 1
-An imperfectly competitive industry is often allocatively inefficient when compared to the performance of a competitive industry,because imperfect competitors
A) make profits.
B) operate in the global economy.
C) set price above the marginal cost.
D) obtain economies of scale.
E) maximize profits.
Correct Answer:
Verified
Q52: In Canada,concentration ratios are the highest in
A)petroleum
Q53: A monopolistically competitive firm has some degree
Q54: Suppose two firms,Allstom from France,and Bombardier
Q55: Suppose two firms,Allstom from France,and Bombardier
Q56: What is a Nash equilibrium?
A)a situation where
Q58: Which of the following is a characteristic
Q59: In long- run equilibrium,a monopolistically competitive industry
Q60: For firms in an oligopoly,the main advantage
Q61: In the long run,a monopolistically competitive firm
Q62: FIGURE 11- 2 ![]()
Unlock this Answer For Free Now!
View this answer and more for free by performing one of the following actions

Scan the QR code to install the App and get 2 free unlocks

Unlock quizzes for free by uploading documents