The diagram below shows selected cost and revenue curves for a firm in a monopolistically competitive industry.
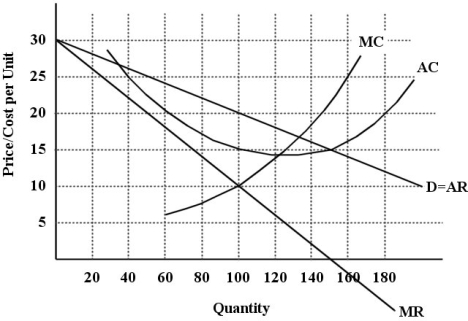 FIGURE 11- 1
-Refer to Figure 11- 1.What price will this profit- maximizing firm set?
A) $10
B) $15
C) $5
D) $20
E) $25
Correct Answer:
Verified
Q64: FIGURE 11- 2 Q65: A monopolistically competitive firm maximizes profits in Q66: The payoff matrix below shows the Q67: An example of a Canadian industry composed Q68: FIGURE 11- 2 Q70: A monopolistically competitive firm and a monopoly Q71: By calculating a concentration ratio,economists measure the Q72: Suppose the market for gasoline retailing (gas Q73: With regard to the long- run equilibrium Q74: Consider an industry that is monopolistically competitive.In![]()
![]()
A)fraction
Unlock this Answer For Free Now!
View this answer and more for free by performing one of the following actions

Scan the QR code to install the App and get 2 free unlocks

Unlock quizzes for free by uploading documents