The diagram below shows demand and cost curves for a monopolistically competitive firm.
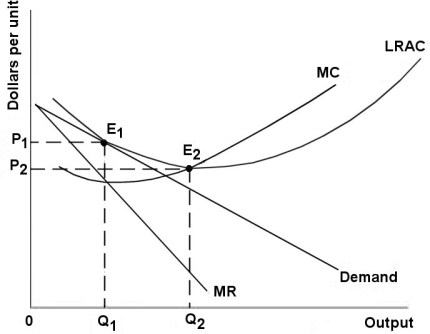 FIGURE 11- 3
-Refer to Figure 11- 3.In the long run,a monopolistically competitive firm will
A) maximize profit but only break even by producing at Q1 and charging price P1.
B) maximize profit and make positive profit by producing at Q1 and charging price P1.
C) lose money by producing at Q1 and charging price P2.
D) maximize profit by producing output level Q2,the minimum point of its LRAC curve
E) make profit by producing at Q2 and charging price P1.
Correct Answer:
Verified
Q101: Of the following,which is the best example
Q102: FIGURE 11- 2 Q103: A duopoly is Q104: The table below shows the market Q105: In which market structure are price fluctuations Q107: The table below shows the market Q108: If firms are able to freely enter Q109: The payoff matrix below shows the Q110: The diagram below shows demand and cost Q111: The payoff matrix below shows the![]()
A)an oligopoly with only two
Unlock this Answer For Free Now!
View this answer and more for free by performing one of the following actions

Scan the QR code to install the App and get 2 free unlocks

Unlock quizzes for free by uploading documents