The diagram below shows a pharmaceutical firm's demand curve and marginal cost and marginal revenue curves for a new heart medication for which the firm holds a 20- year patent on its production.
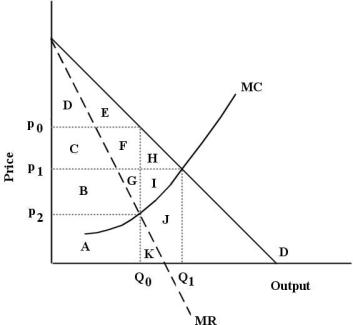 FIGURE 10- 5
-Refer to Figure 10- 5.Assume this pharmaceutical firm is practicing perfect price discrimination among its buyers.At its profit- maximizing level of output it will produce
A) Q1 units and charge a price of p1 on the last unit sold.
B) Q0 units and charge a price of p0 on the last unit sold.
C) Q1 units and charge a price of p1 on all units.
D) Q0 units and charge a price of p0 on all units.
E) It is not possible to determine with the information provided.
Correct Answer:
Verified
Q1: TABLE 10- 2 Your food- services
Q3: Marginal revenue is less than price for
Q4: The diagram below shows a pharmaceutical firm's
Q5: FIGURE 10- 4 Suppose a monopolist faces
Q6: Relative to a firm that must charge
Q7: Consider a profit- maximizing single- price monopolist
Q8: A single- price monopolist is currently producing
Q9: One reason movie theatres charge a lower
Q10: The diagram below shows total revenue for
Q11: TABLE 10- 2 Your food- services
Unlock this Answer For Free Now!
View this answer and more for free by performing one of the following actions

Scan the QR code to install the App and get 2 free unlocks

Unlock quizzes for free by uploading documents