The diagram below shows a pharmaceutical firm's demand curve and marginal cost and marginal revenue curves for a new heart medication for which the firm holds a 20- year patent on its production. 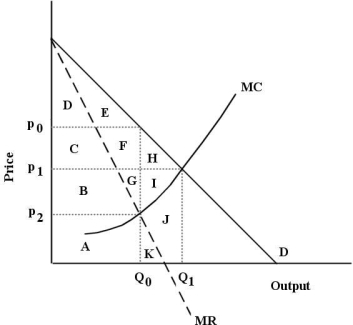 FIGURE 10- 5
-Refer to Figure 10- 5.Assume this pharmaceutical firm charges a single price for its drug.At its profit- maximizing level of output,consumer surplus is represented by
A) areas C+D+E+F.
B) areas D+E.
C) areas H+I.
D) There is no consumer surplus generated.
E) It is not possible to determine with the information provided.
Correct Answer:
Verified
Q74: Your food-services company has been named as
Q94: The cartelization of an industry with a
Q95: The diagram below shows a pharmaceutical firm's
Q97: FIGURE 10- 4 Suppose a monopolist faces
Q98: FIGURE 10- 4 Suppose a monopolist faces
Q100: TABLE 10- 2 Your food- services
Q101: FIGURE 10- 4 Suppose a monopolist faces
Q102: TABLE 10- 2 Your food- services
Q103: The figure below shows the demand
Q104: The figure below shows the demand
Unlock this Answer For Free Now!
View this answer and more for free by performing one of the following actions

Scan the QR code to install the App and get 2 free unlocks

Unlock quizzes for free by uploading documents