The diagram below shows two production possibilities boundaries for Country X.
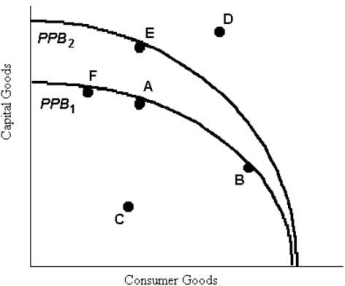 FIGURE 1- 4
-Refer to Figure 1- 4.Suppose that Country X is currently producing at point E.Country X could achieve production at point D if
A) firms reduced output of capital goods.
B) the given resources were fully employed.
C) sufficient improvements in technology occurred in either the capital goods industry or the consumer goods industries.
D) the given resources were more efficiently employed.
E) the prices of capital goods and consumption goods fell.
Correct Answer:
Verified
Q18: The table below illustrates that,in one
Q19: Many economies in central and Eastern Europe,including
Q20: The table below shows that,in one
Q21: The downward- sloping line in the diagram
Q22: If there is always a three- for-
Q24: Which of the following best describes the
Q25: The table below shows that,in one
Q26: The famous economist who first described the
Q27: Consider a production possibilities boundary showing the
Q28: The table below shows that,in one
Unlock this Answer For Free Now!
View this answer and more for free by performing one of the following actions

Scan the QR code to install the App and get 2 free unlocks

Unlock quizzes for free by uploading documents