The diagram below shows two production possibilities boundaries for Country X.
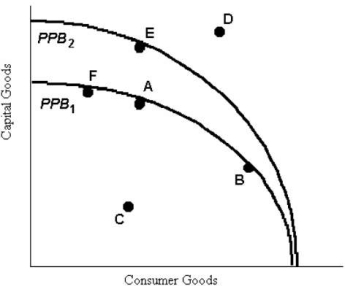 FIGURE 1- 4
-Refer to Figure 1- 4.Growth in the country's productive capacity is illustrated by
A) a movement from a point inside the boundary such as C to the boundary.
B) a single point such as A on the boundary.
C) a point like D outside the boundary.
D) the movement between points on a given boundary.
E) an outward shift of the boundary,for example from PPB1 to PPB2.
Correct Answer:
Verified
Q55: Figure 1- 2 With a budget of
Q56: Figure 1- 2 With a budget of
Q57: A greater specialization of labour leads to
Q58: FIGURE 1- 1
With a budget of $200
Q59: It has been observed that university enrollment
Q61: Madeleine allows herself $100 per month for
Q62: The table below illustrates that,in one
Q63: FIGURE 1- 1
With a budget of $200
Q64: Madeleine allows herself $100 per month for
Q65: The opportunity cost of producing good A
Unlock this Answer For Free Now!
View this answer and more for free by performing one of the following actions

Scan the QR code to install the App and get 2 free unlocks

Unlock quizzes for free by uploading documents