The downward- sloping line in the diagram below shows the combinations of health care and education expenditures that the government can afford with a given amount of tax revenue.
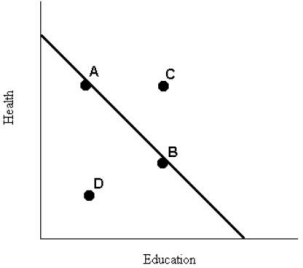 FIGURE 1- 6
-Refer to Figure 1- 6.The levels of health and education expenditures at point C
A) are not attainable with the government's current budget.
B) are equal to those of point A and point B.
C) are less than at point D.
D) are more cost- effective than those at points A,B,and D.
E) could be achieved if the prices of health and/or education increased.
Correct Answer:
Verified
Q5: With a budget of $500 000,a school
Q103: Scarcity is likely to be
A)a result of
Q105: Society's resources are often divided into broad
Q106: Consider the production possibilities boundary (PPB)of an
Q107: The table below illustrates that,in one
Q109: In a modern mixed economy the government
Q110: The diagram below shows two production possibilities
Q111: Complex economic plans for many economic sectors
Q112: Katie and Hugh are producing pies and
Q113: Which countries have mostly public ownership of
Unlock this Answer For Free Now!
View this answer and more for free by performing one of the following actions

Scan the QR code to install the App and get 2 free unlocks

Unlock quizzes for free by uploading documents