The diagram below shows the demand and supply curves for refrigerators in Canada.
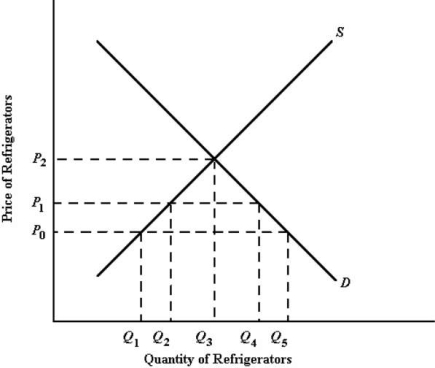 FIGURE 33-1
-Refer to Figure 33-1.At the price P0,the quantity of refrigerators supplied to the Canadian market by domestic Canadian producers is
A) Q1.
B) Q2.
C) Q3.
D) Q4.
E) Q5.
Correct Answer:
Verified
Q28: Canada is a net importer of durable
Q37: Suppose Canada reduces a tariff on imported
Q39: Canada is a net importer of durable
Q43: Suppose Canada reduces a tariff on imported
Q45: If a country is small in world
Q54: Suppose a 10% tariff on all wines
Q64: The diagram below shows the domestic demand
Q139: The diagram below shows the demand and
Q140: The diagram below shows the demand and
Q142: The diagram below shows the domestic demand
Unlock this Answer For Free Now!
View this answer and more for free by performing one of the following actions

Scan the QR code to install the App and get 2 free unlocks

Unlock quizzes for free by uploading documents