The diagram below shows the domestic demand and supply curves for denim jeans in Canada.The prevailing world price is P W.Assume that all jeans are identical.
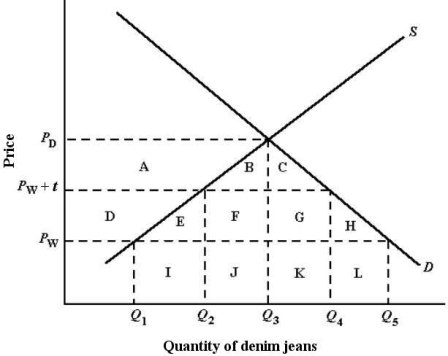 FIGURE 33-2
-Refer to Figure 33-2.Suppose Canada has free trade in jeans.If Canada initially has no tariff on jeans but then imposes a tariff of $t per pair,Canadaʹs imports will
A) increase from (Q4 - Q2) to (Q5 - Q1) .
B) increase from (Q4 - Q2) to (Q5 - Q3) .
C) decrease from (Q5 - Q1) to (Q4 - Q2) .
D) decrease from (Q5 - Q3) to (Q4 - Q2) .
E) decrease from(Q5 - Q3) to (Q3 - Q1) .
Correct Answer:
Verified
Q62: The diagram below shows the domestic demand
Q64: The diagram below shows the domestic demand
Q68: The diagram below shows the domestic demand
Q74: The diagram below shows the domestic demand
Q78: The diagram below shows the domestic demand
Q139: The diagram below shows the demand and
Q140: The diagram below shows the demand and
Q142: The diagram below shows the domestic demand
Q145: The diagram below shows the domestic demand
Q148: The diagram below shows the domestic demand
Unlock this Answer For Free Now!
View this answer and more for free by performing one of the following actions

Scan the QR code to install the App and get 2 free unlocks

Unlock quizzes for free by uploading documents