The diagram below shows the budget deficit function for a government in a hypothetical economy. 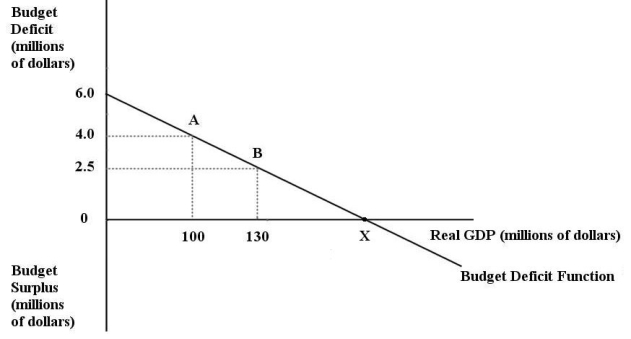 FIGURE 31-1
-Refer to Figure 31-1.Initially,suppose real GDP is $100 million and the budget deficit is $4 million,as shown by point A.If the government implements a contractionary fiscal policy by decreasing its purchases of goods and services,then
A) the budget deficit function would shift up.
B) the budget deficit function would shift down.
C) the budget deficit function would become steeper.
D) the budget deficit function would become flatter.
E) the size of the budget deficit would decrease as we move from point A to point B.
Correct Answer:
Verified
Q38: In every year between 1998 and 2008,the
Q39: The table below shows government purchases (G),net
Q40: The Canadian federal government's net debt as
Q42: The diagram below shows two budget deficit
Q42: The budget deficit function is graphed with
Q43: The diagram below shows the budget deficit
Q46: The diagram below shows two budget deficit
Q49: Consider the budget deficit function.With an unchanged
Q50: Consider the government's budget deficit function.Other things
Q57: Suppose the government's budget deficit falls from
Unlock this Answer For Free Now!
View this answer and more for free by performing one of the following actions

Scan the QR code to install the App and get 2 free unlocks

Unlock quizzes for free by uploading documents