The figure below shows the marginal benefit to consumers,MB,the marginal cost to private firms,MCP,and the marginal cost to society,MCS,at each level of output of some good. 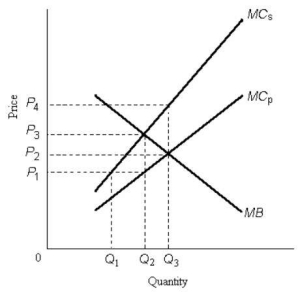 FIGURE 17-1
-Refer to Figure 17-1.A negative externality is depicted because the
A) marginal social cost is greater than the marginal social benefit.
B) marginal social cost is greater than the marginal private cost.
C) marginal social benefit to consumers is diminishing with greater output.
D) optimal level of output occurs where marginal private cost is positive.
E) optimal level of output occurs where marginal private benefit is positive.
Correct Answer:
Verified
Q15: Economists generally view pollution as
A)an economic "bad"
Q16: A paper mill discharges chemicals into a
Q17: A paper mill discharges chemicals into a
Q18: Suppose a firm producing roof shingles imposes
Q19: If pollution is associated with the production
Q21: The socially optimal level of output of
Q22: Suppose a firm producing roof shingles imposes
Q23: What is the "marginal cost of pollution
Q24: When the marginal costs of pollution abatement
Q25: Suppose a firm producing roof shingles imposes
Unlock this Answer For Free Now!
View this answer and more for free by performing one of the following actions

Scan the QR code to install the App and get 2 free unlocks

Unlock quizzes for free by uploading documents