The figure below shows the marginal benefit to consumers,MB,the marginal cost to private firms,MCP,and the marginal cost to society,MCS,at each level of output of some good.
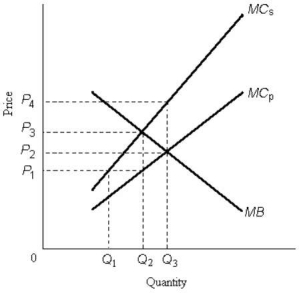 FIGURE 17-1
-Refer to Figure 17-1.The price that leads consumers to demand the socially optimal quantity of output is
A) zero.
B) P1.
C) P2.
D) P3.
E) not possible to know from the information given.
Correct Answer:
Verified
Q1: A paper mill discharges chemicals into a
Q2: A paper mill discharges chemicals into a
Q7: A paper mill discharges chemicals into a
Q8: The social marginal cost of the production
Q9: A paper mill discharges chemicals into a
Q9: When firms in an industry have fully
Q11: A paper mill discharges chemicals into a
Q15: Economists generally view pollution as
A)an economic "bad"
Q19: If pollution is associated with the production
Q20: The figure below shows the marginal benefit
Unlock this Answer For Free Now!
View this answer and more for free by performing one of the following actions

Scan the QR code to install the App and get 2 free unlocks

Unlock quizzes for free by uploading documents