The figure below shows the marginal benefit to consumers,MB,the marginal cost to private firms,MCP,and the marginal cost to society,MCS,at each level of output of some good.
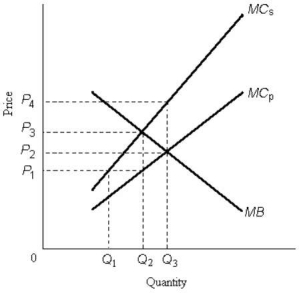 FIGURE 17-1
-Refer to Figure 17-1.The socially optimal level of output is
A) zero.
B) Q1.
C) Q2.
D) Q3.
E) none of the above; there is no optimal output level.
Correct Answer:
Verified
Q15: The figure below shows the marginal benefit
Q16: A paper mill discharges chemicals into a
Q17: Suppose a firm producing roof shingles imposes
Q18: Suppose a firm producing roof shingles imposes
Q19: The figure below shows the marginal benefit
Q23: The diagram below shows the private and
Q24: When the marginal costs of pollution abatement
Q29: The optimal amount of pollution abatement is
Q32: Which of the following is the best
Q33: Economic analysis of the optimal amount of
Unlock this Answer For Free Now!
View this answer and more for free by performing one of the following actions

Scan the QR code to install the App and get 2 free unlocks

Unlock quizzes for free by uploading documents