The diagram below shows the marginal cost of pollution abatement for two firms,Firm X and Firm Y.
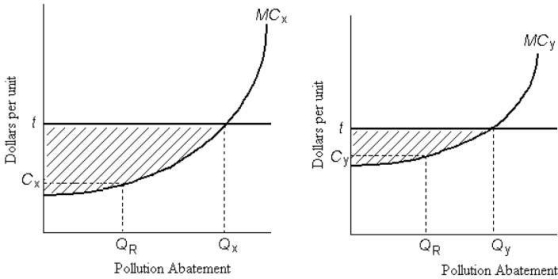 FIGURE 17-6
-Refer to Figure 17-6.There is an emissions tax of $ t per unit of pollution.The resulting amount of pollution abatement is socially optimal if
A) Firm X abates QX and Firm Y abates QY.
B) each firm abates at QR.
C) the emissions tax causes no change in firmsʹ polluting activity.
D) the emissions tax is equal to the marginal social cost of pollution.
E) each firm pays the maximum amount of tax.
Correct Answer:
Verified
Q87: Suppose the government imposes an emissions tax
Q91: The diagram below shows the marginal cost
Q92: The diagram below shows the marginal costs
Q92: Suppose a per-unit tax is imposed on
Q98: A potential disadvantage of emissions taxes versus
Q98: The diagram below shows the marginal costs
Q99: If residential garbage collection were financed by
Q99: The diagram below shows the marginal cost
Q103: A paper mill discharges chemicals into a
Q129: The main advantage of using market-based schemes
Unlock this Answer For Free Now!
View this answer and more for free by performing one of the following actions

Scan the QR code to install the App and get 2 free unlocks

Unlock quizzes for free by uploading documents