The diagram below shows the MRP curve for a firm producing copper plumbing pipe.The factor of production being considered here is hours of labour. 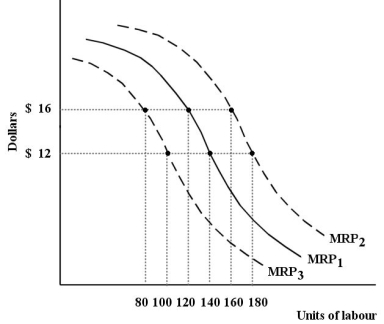 FIGURE 13-1
-Refer to Figure 13-1.This firm's MRP curve is the firm's
A) derived demand for copper plumbing pipe.
B) demand curve for labour.
C) market demand curve for copper plumbing pipe.
D) marginal product of labour curve.
E) total product curve for labour.
Correct Answer:
Verified
Q49: The demand for a factor will be
Q50: Consider a firm's demand curve for labour.If
Q51: The diagram below shows the MRP curve
Q52: Consider a firm's demand curve for labour.If
Q53: In a competitive labour market,an increase in
Q55: Which of the following is the best
Q56: The table below shows the total production
Q57: The table below shows the total production
Q58: The diagram below shows the MRP curve
Q59: A demand for a factor of production
Unlock this Answer For Free Now!
View this answer and more for free by performing one of the following actions

Scan the QR code to install the App and get 2 free unlocks

Unlock quizzes for free by uploading documents