The diagram below shows the MRP curve for a firm producing copper plumbing pipe.The factor of production being considered here is hours of labour.
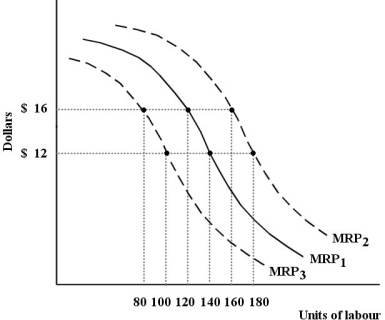 FIGURE 13-1
-Refer to Figure 13-1.Suppose this firm initially has the marginal revenue product curve MRP1.One reason that the curve could shift to MRP2 is
A) a decrease in demand for the firmʹs output,copper plumbing pipe.
B) an increase in the supply of labour.
C) a decrease in the wage rate.
D) a decrease in the market price of copper plumbing pipe.
E) an improvement in workersʹ human capital.
Correct Answer:
Verified
Q44: The table below shows the total production
Q45: The demand curve for a variable factor
Q46: The table below shows the total production
Q48: Which of the following is the best
Q49: The demand for a factor will be
Q51: The diagram below shows the MRP curve
Q52: Consider a firm's demand curve for labour.If
Q54: The diagram below shows the MRP curve
Q56: The table below shows the total production
Q60: The table below shows the total production
Unlock this Answer For Free Now!
View this answer and more for free by performing one of the following actions

Scan the QR code to install the App and get 2 free unlocks

Unlock quizzes for free by uploading documents