The diagram below shows the MRP curve for a firm producing copper plumbing pipe.The factor of production being considered here is hours of labour.
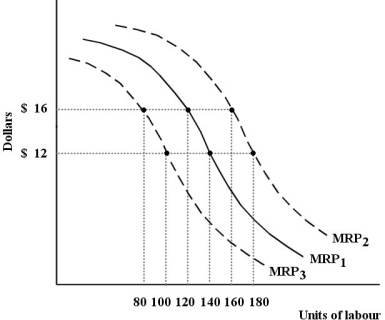 FIGURE 13-1
-Refer to Figure 13-1.Suppose this firm is facing MRP1,a wage rate of $16 per hour and is employing 100 units of labour.At this level of employment,
A) the last unit of labour is adding less to the firmʹs cost than it is adding to the firmʹs revenue,so it should increase the use of labour.
B) the last unit of labour contributes as much to the firmʹs costs as to the firmʹs revenues and so the firm should not change its use of labour.
C) the last unit of labour is adding more to the firmʹs cost than it is adding to the firmʹs revenue,so it should reduce the use of labour.
D) the firm has shifted the MRP curve to MRP2.
E) the firm has shifted the MRP curve to MRP3.
Correct Answer:
Verified
Q63: Consider the following production and cost schedule
Q67: Which of the following statements concerning factor
Q68: Consider the following production and cost schedule
Q72: Consider a firm's demand for a factor
Q78: The diagram below shows the MRP curve
Q89: The difference between temporary factor-price differentials and
Q106: Consider the following demand and supply curves
Q108: Consider the following demand and supply curves
Q110: If the supply curve for a factor
Q112: Alfred Marshall's concept of "transfer earnings" denotes
A)the
Unlock this Answer For Free Now!
View this answer and more for free by performing one of the following actions

Scan the QR code to install the App and get 2 free unlocks

Unlock quizzes for free by uploading documents