The demand and supply curves shown below apply to a competitive market for a factor used in the production of widgets. 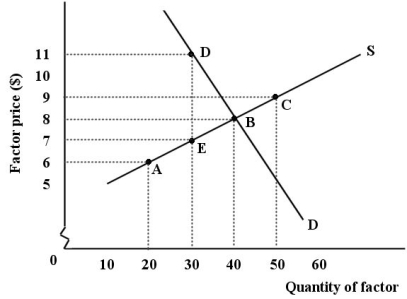 FIGURE 13-2
-Refer to Figure 13-2.This factor market is initially in equilibrium at point B,but changes occur that cause the equilibrium to shift to point D (S curve shifts left) .At the new equilibrium,total factor earnings ________ compared to the initial equilibrium.
A) decreased by $30
B) increased by $30
C) remained the same
D) increased by $10
E) increased by $330
Correct Answer:
Verified
Q113: The earnings of a factor in its
Q114: Consider the following demand and supply curves
Q115: Which of the following would be least
Q116: The demand and supply curves shown below
Q117: Suppose that the municipal government of Calgary
Q118: The demand and supply curves shown below
Q120: Kobe Bryant is a highly paid professional
Q121: The demand and supply curves shown below
Q122: The demand and supply curves shown below
Q123: The demand and supply curves shown below
Unlock this Answer For Free Now!
View this answer and more for free by performing one of the following actions

Scan the QR code to install the App and get 2 free unlocks

Unlock quizzes for free by uploading documents